


HAMADĀN
ii. POPULATION
This article is divided into two sections: (1) population of Hamadān province; and (2) population of Hamadān city.
1. HAMADĀN PROVINCE
Population and its fluctuations. Between 1956 and 1996, the population of this province has increased 2.41 times, rising from 695,283 to 1,667,957 (compared with 3.17 times for the country as a whole). Table 1 shows the growth of the urban and non-urban (rural, non-sedentary, moving and migrant) populations of Hamadān.
A part of the population of Hamadān consists of migrating tribes. According to the census definition most parts of these tribes are considered as rural population and only a small part as non-sedentary. Nevertheless, census data provide some information concerning their number, tribal name and other social characteristics. The latest population survey of this kind was carried out in 1998 and provides us with the information presented in Table 2.
The most important tribe which summers in Hamadān is the Tork Yārom Ṭāqlu tribe. With a total population of 7,234 (1,096 households), this tribe is divided into four groups, according to the location of their winter quarters: Ḵuzestān 4,052 (572 households), Lorestān 1,639 (256 households), Kermānšāh 1,124 (195 households), Ilām 421 (73 households). The Tork Yāram tribe and its four groups account for 79.3% of the migrating tribes but spend the summer in Hamadān.
The most important tribe which winters in Hamadān is the Torkāšvand tribe, which, with a population of 608, consisting of 37.8 households, accounts for 37.8% of the migrating tribes that spend their winter in Hamadān (Markaz-e āmār-e Irān, 1999, pp. 12-59). The average size of the tribal family for those tribes that summer in Hama-dān is 6.54 persons, the Magasseh tribe having the largest families (7.6 persons), and the Jomhur tribe having the smallest (5.7 persons).
Distribution and density of population. Up until 1996, less than half of the population of Hamadān (48.3%) lived in urban areas. Urbanization accelerated after 1991, and although this figure may have exceeded 50% in recent years, Hamadān has still preserved its urban/rural image. Out of an urban population of 810,000 people in Hamadān, 49.5% lived in the city of Hamadān, 17.8 in the city of Malāyer, 8% in the city of Nehāvand, close to 6% in the city of Asadābād, 4.7% in the city of Tuyserkān, 3.2 in the city of Bahār, and the rest (10.8%) in the 10 small cities with populations less than 25 thousand people. The least populated city of the province is Firuzān, with a population of 2,415, which is located northeast of Nehāvand. In 1996, from the point of view of the population, the city of Hamadān ranked 13th amongst the 612 cities of Persia, while Firuzān ranked 591st (Markaz-e āmār-e Irān, 2001, pp. 87, 113, 118).
Between 1996 and 1998 four more cities (Jowreqān and Nehāvand in the governorship of Nehāvand and Azandariān in the governorship of Malāyer and Ṣāleḥābād in the governorship of Bahār) were added to the number of the cities in the province.
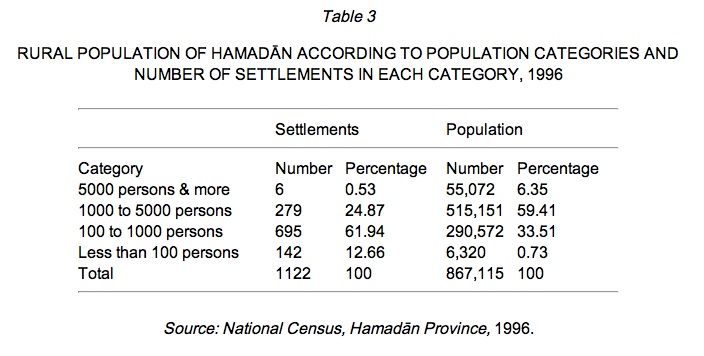
In 1996, the rural population of Hamadān lived in 1,122 villages and its distribution was as shown in Table 3.
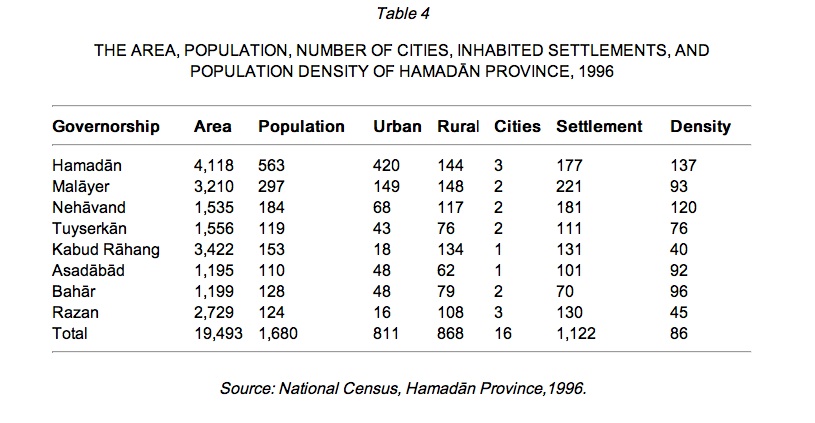
In 1996, the average number of inhabitants per settlement was 773 persons, which is 2.28 times the average for the country as a whole. Table 4 gives a bird’s eye-view of the area (km2), population (in thousands), and number of cities and inhabited settlements, as well as the population density per square kilometer of Hamadān province.
Reproduction and mortality. According to the National Bureau of Registrations (Edāra-ye koll-e ṯabt-e aḥwāl-e kešvar), there were 31,679 births and 6,738 deaths during 1996 in the province of Hamadān. This gives us a birth rate of 19 per thousand, a death rate of 4 per thousand and a natural growth rate of 15 per thousand, or 1.5%, compared with the average per annum for the period 1986-1996, which is estimated as 2.5% in the Master Plan of Hamadān Province (Moʾassesa-ye ʿāli-e pažuheš dar barnāma-rizi wa tawseʿa, pp. 6-37).
However, according to the demographic survey of the Regional Development Plan (Markaz-e moṭāleʿāt wa taḥqiqāt-e šahr-sāzi wa meʿmāri-e Iran, p. 13) the total fertility rate in 1996 for this province was 3.75 children (2.93 for the urban, and 4.57 for the rural areas), and as the mortality rate was 8.6 per thousand (Zanjāni and Nur-Allāhi, p. 66), the natural rate of population growth is estimated to be about 2 (2.04) per thousand.
Migration. In the past the province of Hamadān has been a net source of emigration and until 1976 had a negative migratory balance of some 202 thousand persons (Zanjāni, 2001,pp. 94-106). Between 1976 and 1986, however, Hamadān hosted a number of refugees from the war zones. Nonetheless, it continued to remain a net source of emigration, albeit with a smaller negative migratory balance of some 50,933 persons. This trend continued between 1986 and 1996, when Hamadān’s negative migratory balance amounted to 42,974 persons (National Census, Ostān-e Hamadān, 1996). It seems that this trend will continue in the near future and emigration will partially compensate for Hamadān’s natural population growth.
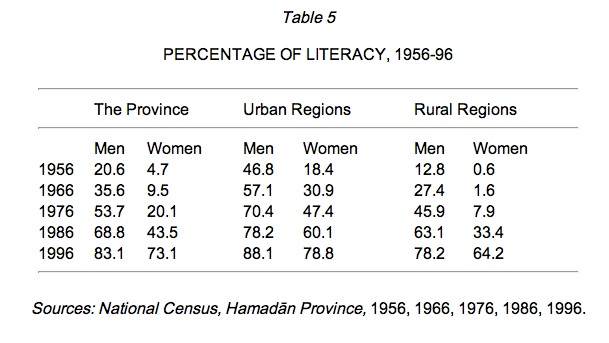
Literacy. In 1996 slightly over 77 percent of the population of the province of Hamadān was literate (83.1 percent for men, 71.3 percent for women). The percentage, especially for women, has risen considerably after the revolution, as shown by Table 5.
The literacy rate for the 6-10 year old age group was 96.2 percent for boys and 94.9 percent for girls in 1996, which shows the high coverage of elementary education. For the 11-14 year-old age group (lower high school) the figures were 98.6 percent and 97.9 percent, while for the 15-19 year-old age group (upper high school) they were 97.9 percent and 96.1 percent. The highest percentage for the over six-year old population belongs to the governorship of Hamadān, while the lowest belongs to the governorship of Razan. The level of education of 53.3 percent of the literate population was elementary school or lower, that of 40.2 percent was between elementary school and high school and that of 4.2 percent was advanced education (Āmār-nāma-ye Ostān-e Hamadān, pp. 93-97).
Religion. The overwhelming majority of the population of Hamadān were Moslems, who in 1996 accounted for 99.88 percent of the total population. In that year there were 308 Zoroastrians, 86 Christians, 47 Jews and 492 followers of other religions; 1,015 persons had not declared their religion.
Marriage. In 1996, nearly 51.9 percent of men and 53.5 percent of women of the over ten-year-old population of this province were married; 1.03 percent of men and 6.6 percent of women were widows and widowers, and 46.7 percent of men and 38.9 percent of women had never married (46.1 percent and 37.7 percent in the urban areas, and 47.4 percent and 40.1 percent in the rural areas; National Census, Ostān-e Hamadān, 1996).
Households. In 1996, there were 341,789 ordinary sedentary households, 33 ordinary non-sedentary households and 262 collective households in this province. Ordinary households on average were composed of 4.85 members (4.54 for the urban and 5.17 for the rural areas). 9.13 percent of ordinary households consisted of the head of the household and his spouse, 67.31 percent consisted of the head of the household, his spouse and children, 5.1 percent consisted of the head of the household and children, and 18.5 percent were other types of households. In 8.9 percent of ordinary households, the head of the household was a woman and in this respect there was no significant difference between the urban and rural areas. 81.8 percent of the heads of the households (88.7 percent of males and 11.8 percent of females) were employed. Households of 4 and 5 members, making up 17.01 and 15.48 percent of the total, are the most common, followed in frequency by households of 3 members and 6 members, at 15.41 percent and 13.42 percent, respectively.
Housing and housing facilities. None of the households of this province lived in tents, barracks or makeshift dwellings and close to 100 of them had normal housing units at their disposal. 98.8 percent of the households had electricity, 82.8 percent had piped water, 44.2 percent (72.1 percent in the urban areas and 14.5 percent in the rural areas) had bathrooms in their houses and 22.7 percent (38.3 percent in the urban areas and 14.5 percent in the rural areas) had telephones. 78.8 percent of the households (72 percent in the urban areas and 86 percent in the rural areas) were owners of their houses and 10.5 percent (18.1 percent in the urban areas and 2.6 percent in the rural areas) were lease-holders. The rest had other types of housing at their disposal.
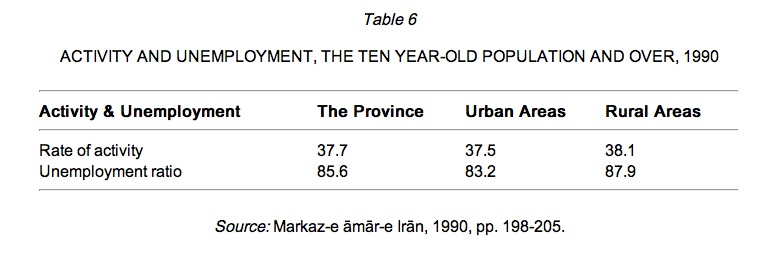
Activity and employment. The rate (in percentages) of activity and unemployment of the over ten-year-old population of the province is shown in Table 6.
Moreover, 2 percent of the over ten year-old population of the province (2.67 percent in the urban areas and 1.32 percent in the rural areas) have had revenues without employment.
Income and expenditure. According to the random samplings taken from 1993 to 1997, household income and cost of living data are as shown in Table 7.
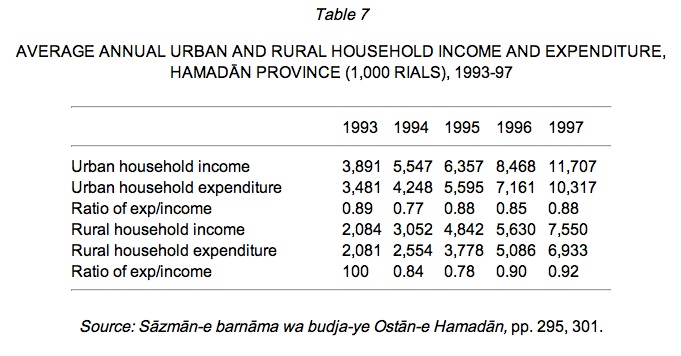
The cost of living index rose in the urban areas from 100 in 1990 (base year) to 448.6 in 1996 and 624.3 in 1998, and in the rural areas from 100 in 1990 (base year) to 1197.2 in 1996 (ibid. pp. 285, 289).
Population projection. On the basis of studies made in the Regional Development Plan, the population of this province is likely to grow from 2001 to 2021 in the manner shown in Table 8.
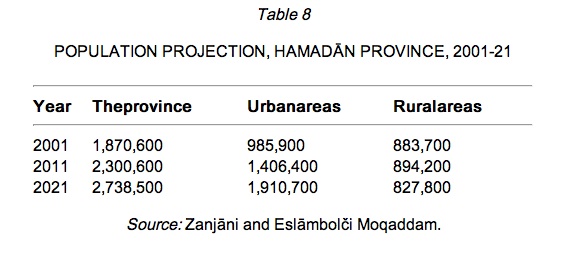
This suggests that with annual rates of growth of 1.92, 3.36 and 0.03 percent for the province as a whole, the urban areas and the rural areas respectively, within a period of two decades the urban population will increase by 94 percent while the rural population will decline by 6.3 percent.
2. THE CITY OF HAMADĀN
Population. Between 1939 and 1941, censuses were carried out in 35 cities; that of Hamadān took place in 1940, when it was found to have a population of 103,874 people. Prior to that, in 1929 it was around 60,000, while in 1937 it was 80,280 (Mojdā, p. 42). Table 9 indicates how the population of Hamadān has evolved on the basis of the succeeding censuses from 1966 to 1996.
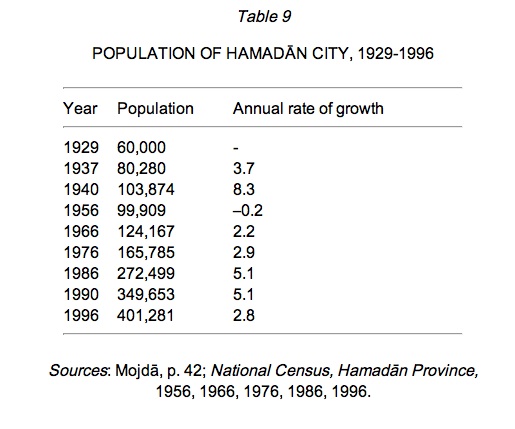
This shows that the peak years for population growth were between 1937 and 1940, while the slowest rate of growth was recorded during the occupation of the country from 1941 during World War II. After the Islamic Revolution the rate of population growth in Hamadān has been higher than that of the urban population in the country as a whole. For the period 1976-96, while the annual rate of growth of the urban population for the country as a whole was 4.30 percent, that of Hamadān reached 4.52 percent.
Education and literacy. In 1956, 30.8 percent of the over ten-year-old population of Hamadān (44.0 percent for males and 17.8 percent for females) were literate (1956 census, p. 16). In 1996 the same ratio for the over six-year-old population had increased to 83.9 percent (86 percent for males and 75 percent for females; 1996 census, p. 44). Given that school admission has been changed, for 1966 this ratio has been calculated for the over seven-year-old population and for the following years for the over six-year-old population, as indicated in Table 10.
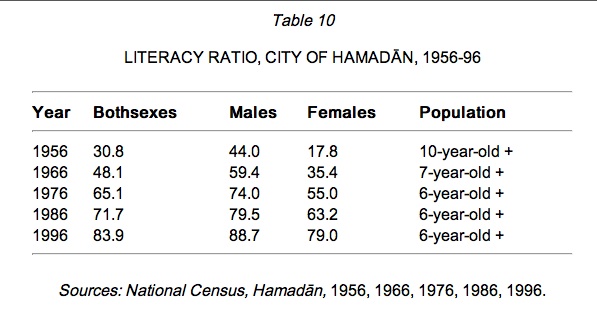
Throughout this period the ratio of literate females to literate males has been constantly rising: It rose from 40.5 percent in 1956, to 59.6, 74.0, 79.5 and 94.2 in the succeeding censuses.
As for the level of education, it is interesting to note that the number of people with advanced education has increased from 164 people in 1956 (149 males and 15 females) to 2011 in 1976 (1, 497 males and 514 females) and 11,173 people in 1996 (6,544 males and 4,629 females), which shows that within a period of forty years the number of males with advanced education has multiplied by 44 while the number of females with advanced education has increased some 309 fold. It also indicates the narrowing of the wide gap between the sexes from 9.9 times to 1.4 times as many men.
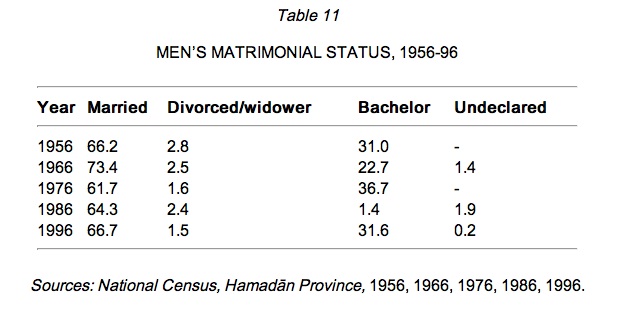
Matrimonial situation. The distribution of the over 15-year old male population of Hamadān from the point of view of matrimony is shown in Table 11.
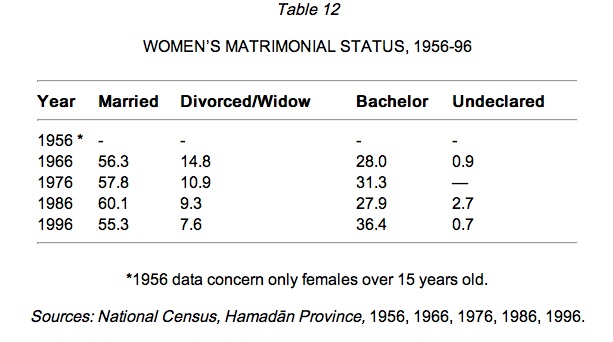
As for women, the situation for the over 10-year-old population was as shown in Table 12.
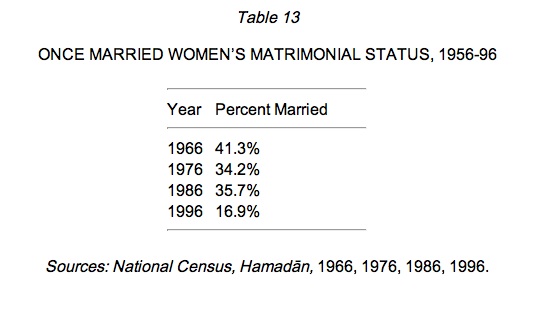
These figures indicate changes in the matrimonial situation before and after the revolution. Between 1966 and 1976, the legal age for marriage was raised and there is a significant drop in the percentage of married men, but not married women. After 1976 the percentage of married men increased steadily, but the percentage of married women increased only until 1986, falling sharply thereafter, and reaching its lowest ever level in 1996. This trend reflects the increased participation of women in advanced education and their determined efforts to raise their social status and participate more actively in economic and civic activities. There is a good chance that this trend will continue in the near future. In this connection, it is interesting to note that the percentage of 15-19-year-old females who have married at least once has decreased in the way indicated in Table 13 between 1966 and 1996.
As can be seen, there is a sharp drop between 1986 and 1996 when the percentage is more than halved in just ten years.
Activity and employment. In 1996, some 77.5 percent of the population of Hamadān was made up of the over ten–year-old population, which, under the census definition, is considered to be the age to work. Economically, 35.24 percent of this population are considered to be active, out of which 90.9 percent were employed and 9.1 percent were unemployed. Just over one-third of the employed were employed in industry, 61.6 in services, 3.9 in agriculture and less than 1 percent in unclassified activities (1996 census, p. 44). Compared with the data for 1986, the level of activity has dropped by 13.4 percent, employment has dropped by 11.1 percent and unemployment has fallen by 37 percent.
More than half (52.5 percent) of those in search of employment were between 10 and 25 years old, and nearly 40 percent of them were between 25 and 65 years old. 14.4 percent were illiterate, 20.3 percent had elementary education, 57.5 percent had high school education and 4.6 percent had advanced education.
Amongst the unemployed urban population of the province (and 95.6 percent of the urban population of the province lived in the city of Hamadān) 44.6 percent were previously employed, out of which, prior to losing their jobs, 22.7 percent were employed in construction, 18.6 percent in manufacturing, 16.7 percent in agriculture, 14.9 percent in “sale and repair of motor vehicles and household equipment,” 9.6 percent in transport and communications and the rest in miscellaneous occupations. As for the length of unemployment, 34 percent were unemployed for more than 25 months, 13.8 percent for between 13 and 25 months, 18.9 percent for between 7 and 13 months, and the rest for less than 7 months.
Women accounted for 14.1 percent of the unemployed urban population of the province, and 2.4 percent of those who had previously been employed. 53.8 percent of the latter were employed in the public sector, while for men this applied to only 15.8 percent (1996 census, pp. 233-54).
Household size and composition. Variations in the size of ordinary households during the census years have been as shown in Table 14.
This shows that birth control policies have reduced the size of households between 1966 and 1976 and their abandonment has brought about their increase in size between 1976 and 1986.
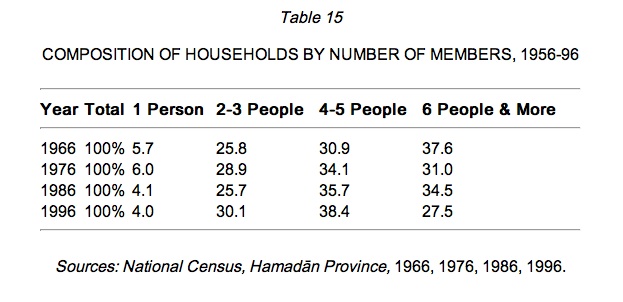
The distribution of households according to the number of members is shown in Table 15.
These figures confirm the effects of birth control policies implemented between 1947 and 1978 and after 1989 on the distribution of households. In both these periods the number of households with two and three members and four and five members increased while simultaneously the number of households with six members and more declined. On the other hand, the number of one-member households has been falling steadily since 1976.
Housing. As there have been minor modifications in the definition of households and housing units in various censuses, a special effort should be made to compare the comparable data.
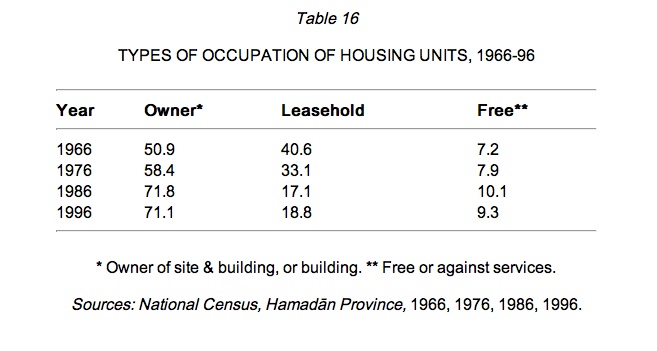
Occupation of housing units. The frequency of distribution of the three main types of occupation of housing units is shown in Table 16 (figures in percentages for ordinary sedentary households).
The percentage of owned housing units increased considerably between 1966 and 1986. This must have been due, for the period 1976 to 1986, to the urban land policy that was adopted and the housing facilities made available after the revolution. It remained more or less stabilized in the next decade. In parallel, the number of leaseholds declined, especially during the first decade of the revolution. Its slight rise in the next decade may be attributed to the rising price of land and mounting inflation.
Types of housing units. Nearly all the households in the city of Hamadān live in ordinary housing units, the percentage having risen from 99.77 in 1966 to 99.98 in 1996, such that the number of households living in tents, make-shift dwellings and the like declined from 82 in 1966 and 97 in 1976 to 16 in 1996 for all the urban areas of Hamadān. Simultaneously, the percentage of households living in one-bedroom housing units declined from 48.2 percent in 1966 to 27.2 percent in 1976 in the city of Hamadān, and to 12.0 percent in 1986, and 5.8 percent in 1996, in the urban areas of the county of Hamadān (Hamadān censuses).
Housing facilities. The main facilities accounted for by the data are electricity, piped water, telephone and gas. Table 17 indicates the availability of these facilities (figures in percentage of housing units).
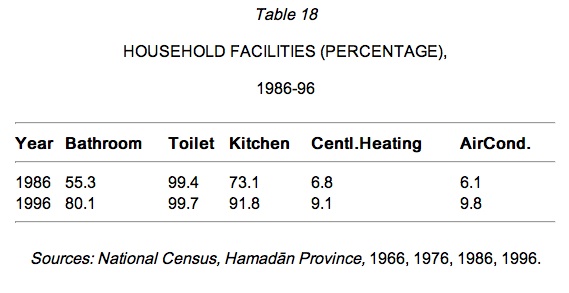
From 1986 data were also gathered about bathrooms, toilets, kitchens and the use of central heating; the percentage of housing units benefiting from such facilities are shown in Table 18.
The temperate climate of Hamadān partially accounts for the low percentage of housing units with air conditioners.
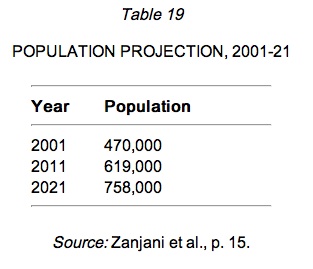
Population projection. The projected estimate of the population of the city of Hamadān in 2003 according to Hamadān’s Development and Construction Plan (Ṭarḥ-e tawseʿa wa ʿomrān-e Hamadān) is 552,000 people. The latest population projection for the city, made in the Regional Development Plan (Ṭarḥ-e āmāyeš-e sarzamin) in 2000, is reproduced in Table 19.
Population projections made under the National Phy-sical Plan (Ṭarḥ-e kālbodi-e melli) in the early post-revolutionary period of a high rate of growth foresaw a population increase from 970,000 to 1,153,000 for Hamadān in 2021, which, given the rapid decline in the rate of population growth during the past 15 years, seems quite unlikely to be realized.
Bibliography
Markaz-e moṭāleʿāt wa taḥqiqāt-e šahr-sāzi wa meʿmāri-e Irān, Ṭarḥ-e kālbodi-e melli, gozā-reš-e talfiqi I, Tehran, 1996.
Markaz-e āmār-e Irān, Āmārgiri az vižagihā-ye ešteḡāl wa bikāri-e ḵānavār, Tehran, 1990.
Idem, Natāej-e tafṣili-e saršomāri-e sāl-e 1996, Ostān-e Hamadān (publications 2-25), 1998.
Idem, Saršomāri-e eqteṣādi-ejtemāʿi az ʿašāyer-e kučanda-ye kešvar, Tehran, 1999.
Idem, Āmārgiri az vižagihā-ye ešteḡāl wa bikāri-e ḵānavār, Tehran, 2000.
Idem, Jamʿiat-e šahrhā-ye Irān, 1956-1996, Tehran, 2001.
Moʾassesa-ye ʿāli-e pažuheš dar barnāma-rizi wa tawseʿa, Ṭarḥ-e moṭāleʿāt-e jāmeʿ-e tawseʿa-ye Ostān-e Hamadān, Section 2: Omur-e ejtemāʿi, Tehran, 2002.
Mohandesin-e Mošāwer-e Mojdā, Ṭarḥ-e tawseʿa wa ʿomrān-e Hamadān, Hamadān, 1984.
Sāzmān-e barnāma wa budja-ye Ostān-e Hamadān, Āmār-nāma-ye Os-tān-e Hamadān, Hamadān, 1998.
Ḥabib-Allāh Zanjāni, Jamʿiat wa šahrnešini dar Iran, I, Jamʿiyat, Markaz-e moṭāleʿāt wa taḥqiqāt-e šahr-sāzi wa meʿmāri-e Irān, 2nd ed., Tehran, 1992.
Idem, Mohājerat, Tehran, 2001.
Idem and Simin Eslāmbolči Moqaddam, Moṭāleʿāt-e jamʿiat dar ṭarḥ-e āzmāyeš-e sarzamin, Markaz-e moṭāleʿāt wa taḥqiqāt-e šahr-sāzi wa meʿmāri-e Iran, Sections 3-5, 1998.
Idem, et al., Sawābeq-e jamʿiati-e šahrhā wa ābādihā-ye Ostān-e Hamadān, publication nos. 2-4, in Ṭarḥ-e kālbodi-e melli, Markaz-e moṭāleʿāt wa taḥqiqāt-e šahr-sāzi wa meʿmāri-e Iran, Tehran, 1992, p. 7.
Idem & Fereydun Raḥmāni, Rāhnemā-ye jamʿiat-e šahrhā-ye Iran, 1335-1370, Markaz-e moṭāleʿāt wa taḥqiqāt-e šahr-sāzi wa meʿmāri-e Iran, Tehran, 1989.
Idem & Ṭāhā Nur-Allāhi, Jadāwel-e marg o mir-e Irān barā-ye sāl-e 1375, Tehran, 2000.