

KHALKHAL
ii. Basic Population Data, 1956-2011
This article deals with the following population characteristics of Khalkhal city: population growth from 1956 to 2011, age structure, average household size, literacy rate, and economic activity status for 2006 and/or 2011 (different dates for the categories are determined by the availability of census data).
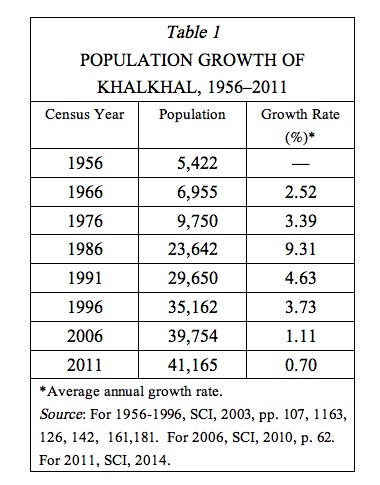
Population growth. Khalkhal has experienced a high rate of population growth, increasing more than sevenfold from a population of 5,422 in 1956 to 41,165 in 2011. During the period 1956-76, the average annual growth rate was approximately 3 percent, from 5,422 to 9,750 people. From 1976 to 1986, the population growth rate of Khalkhal reached 9.31 percent per year, as the population almost tripled, to 23,642 people. Since Khalkhal was one of the safer cities in the country during the Iran-Iraq War, 1980-88 (on which, see IRAQ vii), this increase may be attributed to war-related population movements. As the war came to an end (i.e., after the cease-fire of 1988) the population growth rate for Khalkhal dropped to 4.63 percent per year between 1986 and 1991 and to 3.73 percent per year between 1991 and 1996. Consequently, the population of Khalkhal reached 29,650 in 1991 and 35,162 in 1996. Since then, the annual population growth rate for Khalkhal has continued to decrease, falling to 1.11 percent between 1996 and 2006 and to 0.7 percent between 2006 and 2011, as the population grew slowly from 35,162 in 1996 and to 39,754 in 2006 and to 41,165 in 2011 (Table 1).
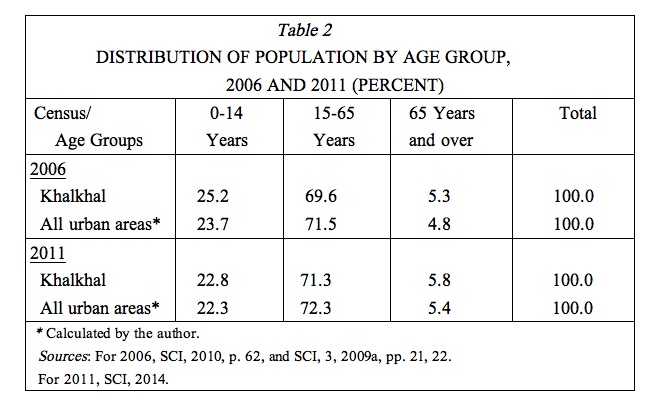
Age structure. The population of Khalkhal can be considered as young. In 2011 almost 71.3 percent of the population was in the activity ages of 15 to 64, another 22.8 percent were below 15 years of age and only 5.8 percent were 65 and over. The age structure in 2006 was even younger than that in 2011 and also than that of urban areas as a whole in the same year (Table 2).
Average household size. In 2006, the average household size in the city of Khalkhal was 4.1 persons per household (National Census, 2006; SCI, 2010, p. 92), which was slightly higher than the average of 3.89 for urban areas as a whole (SCI, 2009b, p. 50). In 2011 the average size declined to 3.67 persons per household (SCI, 2014), not significantly higher than the average size of 3.48 for the urban areas as a whole (SCI, 2014).
Literacy rate. In 2006, almost 87.8 percent of the population of Khalkhal six years of age and over were literate. The literacy ratio was significantly higher for males (91.9 percent) than for females (83.9 percent; SCI, 2010, Table 4, p. 151). Comparison to urban areas in general, either for both sexes (88.9 percent) or for each sex (92.2 percent for male and 85.6 percent for female; SCI, 2009b, pp. 223, 225, 227) suggests relatively lower literacy condition in Khalkhal.
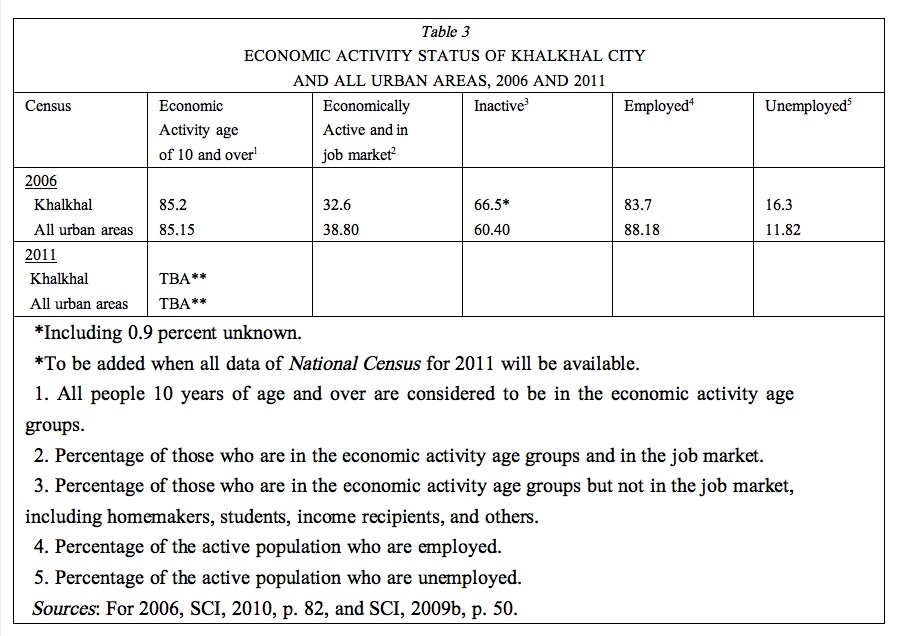
Economic activity status. In 2006, almost 85.2 percent of the population of Khalkhal, or 33,889 people, were in the activity ages (i.e., 10 years of age and over), of whom 32.6 percent were economically active and 66.5 percent inactive, while the status of the rest (0.9 percent) was unknown. The activity ratio in Khalkhal is significantly lower than the national average ratio for cities (38.8; SCI, 2009b, p. 35). The employment and unemployment ratios in Khalkhal are estimated at 83.7 percent and 16.3 percent of the active population (i.e., of 32.6 percent of the total population). These figures indicate the ratio of employment in Khalkhal is lower than the national average ratio for cities (with 88.2 percent employed and 11.8 percent unemployed; SCI, 2010, p. 188; Table 3).
Bibliography (for cited works not given in detail, EIr Short Titles):
National Census for Khalkhal, 1956, 1966, 1976, 1986, 1996, 2006, and 2011.
SCI (Statistical Center of Iran), Tawziʿ wa ṭabaqa-bandi-e jamʿiyat-e šahrhā-ye kešvar dar saršomārihā-ye 1335-75 [years 1956-196], wa taṭbiq-e tawziʿ-e joḡrāfiāʾi-e jamʿiyat-e ostānhā 1382 [year 2003], Tehran, 2003.
Idem, Natāyej-e saršomāri-e ʿomumi-e nofus va maskan-e 1385 [year 2006], jamʿiyat-e šahrhā-ye kešvar bar ḥasab-e sen va jens, koll-e kešvar, III, Tehran, 2009a.
Idem, Saršomari-e ʿomumi-e nofus va maskan-e 1385 [year 2006], natāyej-e tafṣili, koll-e kešvar, I, part 1, Tehran, 2009b.
Idem, Gozida-ye namāgarhā-ye jamʿiyati-e šahrhā-ye kešvar bar asās-e natāyej-e saršomāri-e ʿomumi-e nofus va maskan-e 1385 [year 2006], Tehran, 2010.
Idem, “2011 Census Selected Results—UNFPA Iran,” electronically published, 2014; available at http://iran.unfpa.org/view_news.asp?id=248.
(Mohammad Hossein Nejatian)
Originally Published: December 12, 2014
Last Updated: December 12, 2014
Cite this entry:Mohammad Hossein Nejatian, "KHALKHAL ii. Basic Population Data, 1956-2011," Encyclopædia Iranica, online edition, 2014, available at http://www.iranicaonline.org/articles/khalkhal-02-population (accessed on 12 December 2014).