

ISFAHAN
iii. Population
(2) Isfahan Province
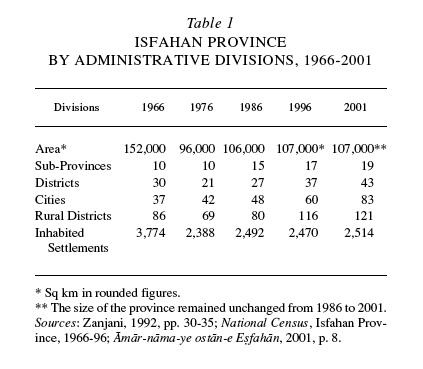
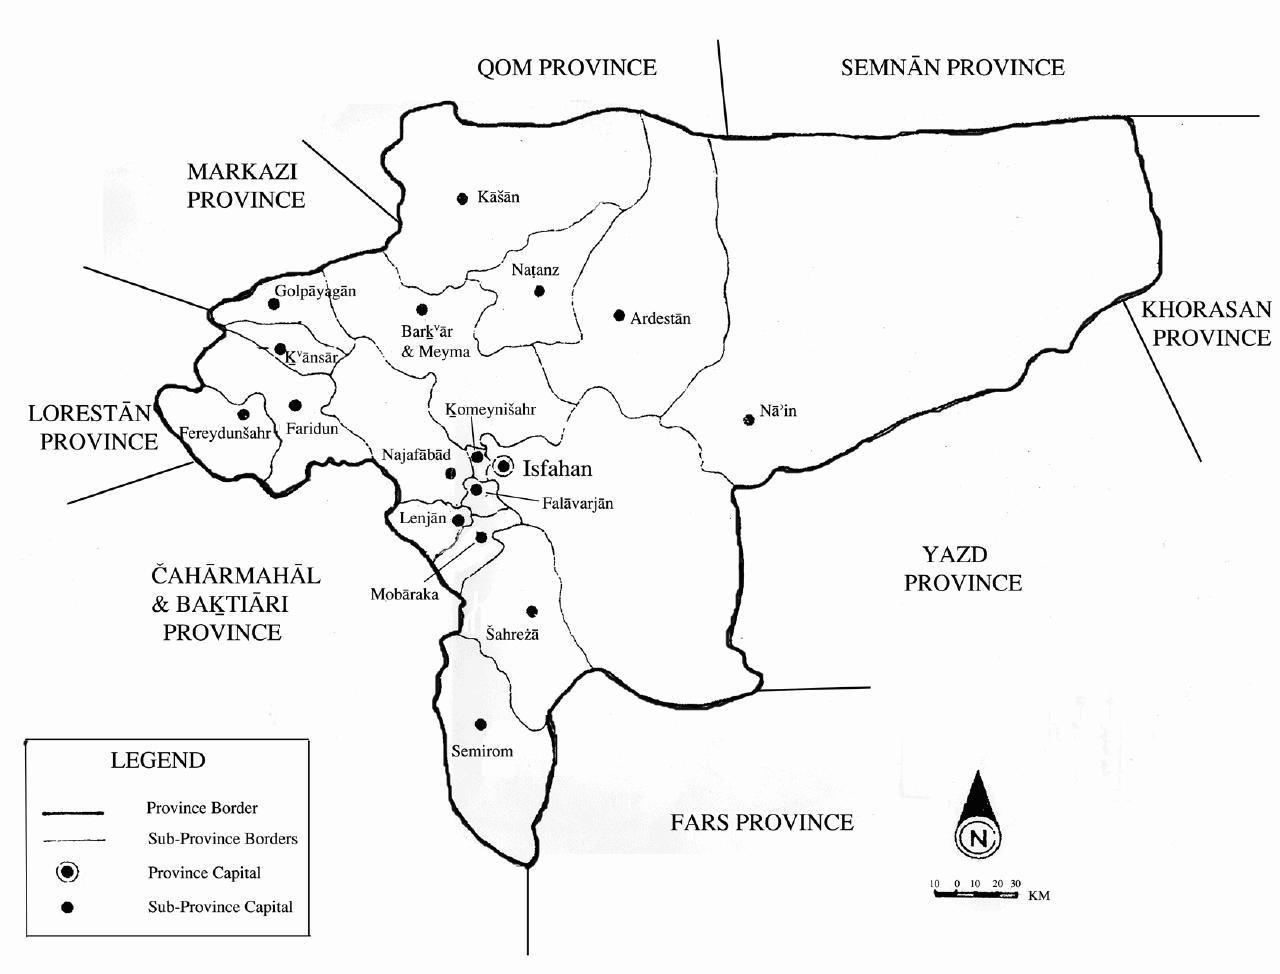
Administrative divisions. In 2001, the province (ostān) of Isfahan comprised 19 sub-provinces (šahrestāns), 83 towns in 43 districts (baḵš), and 2,514 rural settlements in 121 sub-districts (dehestāns). The administrative divisions of the province in the period between 1966 and 2001 are given in Table 1. It should be noted that, up to and including the 1966 census, the province of Yazd was counted within the boundaries of Isfahan Province, and from the 1986 census, the sub-province of Kāšān was annexed to Isfahan Province.
Figure 1. Map of Isfahan Province by administrative divisions.
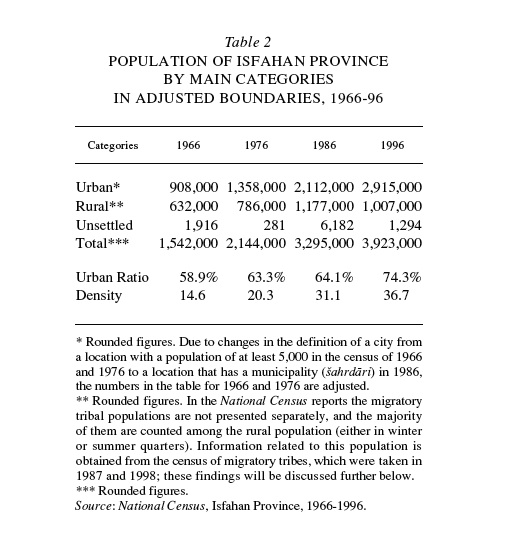
Population and its distribution. The above changes to the province boundaries make it difficult to define recent historical trends for the population of the present-day province. Table 2 shows the census data in adjusted boundaries for the population of Isfahan Province from 1966 to 1996. The census data for Kāšān Sub-province, which was from 1986 within the boundaries of Isfahan Province, has been added. The census data for Yazd Sub-province, which was no longer within the boundaries of Isfahan Province after 1966, has been subtracted.
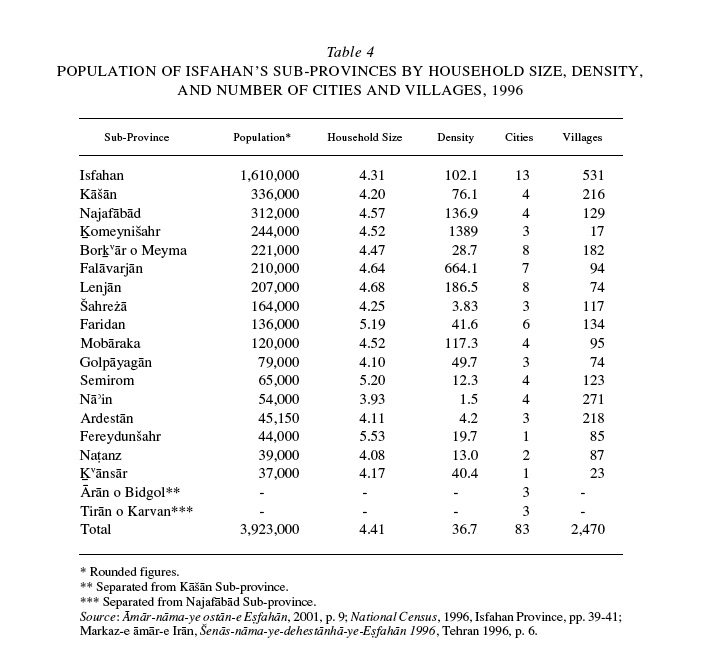
In terms of population distribution, the sub-provinces of Isfahan (with more than 1.6 million), Kāšān, and Najafabād (with more than 300,000) were the most populated, while the sub-provinces of Naṭanz, Fereydunšahr, and Ardestān were the least populated with populations of less than 50,000 persons. Table 4 shows the distribution of population in the year 1996 and its main features by sub-province. Ḵomeynišahr is at the bottom of this table as the smallest sub-province, with a total area of 175 sq. km, while Isfahan was the largest sub-province with a total area of 15,744 sq. km. Among sub-provinces, the average size of households varied between 3.93 (Nāʾin) and 5.53 (Fereydunšahr). In terms of density, Ḵo-meynišahr is the most densely populated sub-province with 1,398 persons per sq. km, while Nāʾin is the least densely populated sub-province with 1.5 persons per sq. km.
Age and gender structure. The province of Isfahan had an even gender structure with a male/female ratio of 1.05 in 1996, a figure that is consistent in both rural and urban areas. The gender ratio in different age groups has also been even, and among children less than one year old, this figure has been equivalent to the national level of 1.05 (both in the province and in the cities and villages). The age group of 65 years old and over has also exhibited a gender ratio of 1.03 (1.02 in urban areas and 1.06 in rural areas) without any unusual fluctuations.
In terms of age structure, 36.7 percent of the population was under the age of 15, while senior citizens account for 4.8 percent. These figures are 35 percent and 4.5 percent, respectively, in urban areas and 38.9 percent and 5.6 percent in rural areas.
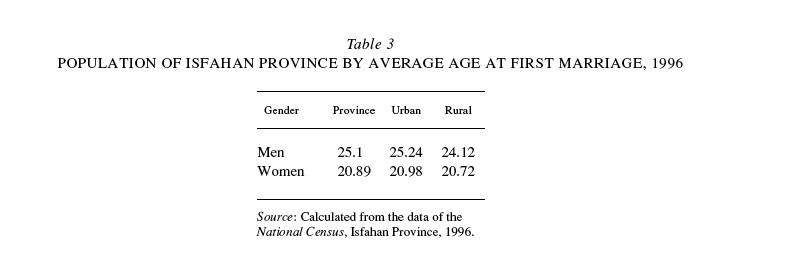
Marital status. A little more than three-quarters of women (77.7. percent) and two-thirds of men (66.6 percent) over the age of 15 in urban areas have been married at least once. These percentages are 77.2 percent and 65.8 percent, respectively, in rural areas and, as such, there is no significant difference between the two areas. The most important difference in terms of the martial status of men and women is the difference in the percentage of widows due to death of their partners. In the urban population, 0.94 percent of men are widowers and 7.75 percent of women are widows, while in the rural population these figures are 1.14 percent and 8.18 percent, respectively. The median age at the time of first marriages for men and women in the province in 1996 is presented in Table 3
These figures show that the marital status in urban and rural areas is quite similar, especially for women. It should be noted that differences between the average age of first marriages of men and women have decreased, reaching approximately 4.2 years for the province (4.3 years in urban areas and 3.4 years in rural areas).
Migration. The province of Isfahan, which until 1966 also included the province of Yazd, had a negative net balance of migration with negative 109,717, and this trend continued until 1976, when it reached negative 124,555. However, in the 10-year period between 1976 and 1986, Isfahan was a net source of immigration with a migratory balance of +85,157. This situation continued in the period between 1986 and 1996, and the province was still a source of immigration with 591,640 immigrants and 500,851 emigrants, resulting in a net balance of +90,789 (of these, 334,501 had moved between and within sub-provinces; Zanjani, 2001, pp. 80, 94). Between 1986 and 1996, about 32 percent of immigrants moved within a sub-province, while 21.6 percent of them moved between sub-provinces. Furthermore, of the total immigrant population, 40.1 percent entered Isfahan from other provinces, and 2.9 percent were born outside the country. Of the total immigrant population, 74.3 percent had previously resided in a city, and 22.3 percent were from villages; of the total immigrant population, 75.9 percent settled in urban areas, while the rest settled in rural areas.
The ratio of male immigrants to female immigrants settling in urban areas was 1.25, while the ratio among those who settled in rural areas reached 1.77, a figure that is much higher than the gender ratio for the province as a whole (1.05). This shows that there was more displacement among men and reflects the scarcity of resources as well as unemployment among the population, leading men to relocate in order to pursue either employment or a better job.
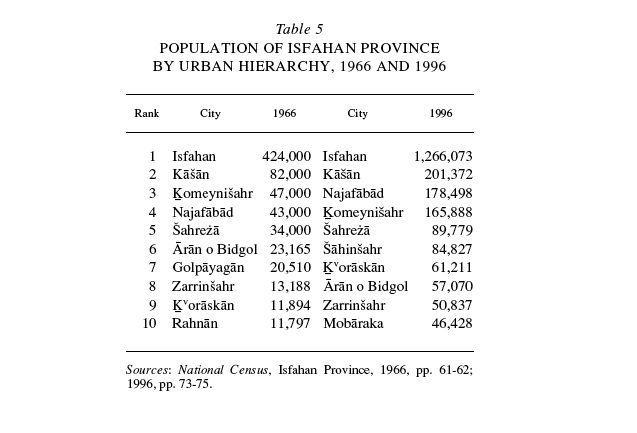
Urban and rural populations. As a result of the increase in the proportion of the urban population of the province from 58.9 percent of the total population in 1966 to 74.3 percent in 1996, there were changes in the urban hierarchy, the most important of which occurred in the order of most populated cities. Throughout this 30-year period, the most populated city (Isfahan), the second most populated city (Kāšān), and the fifth most populated city (Šahreżā) remained among the 10 most populated cities. In the same span, the cities of Ḵomeynišahr, Golpāyagān, Zarrinšahr, and Rahnān (Ranān) dropped in position, while the cities of Šāhinšahr and Mobāraka entered the top 10 from previously lower positions. Table 5 shows the ten most populated cities in the province in 1966 and 1996.
The city of Isfahan fell in the national urban hierarchy (most populated cities), from second place in 1966 (behind Tehran) to third place in 1996 (behind Tehran and Mashad).
The percentage of the urban population of the sub-provinces ranged from 24 percent in Faridan to 86.8 percent in the sub-province of Isfahan. Among the other sub-provinces, Ḵomeynišahr, Barḵᵛāvar and Meyma, Najafābād, and Kāšān had the next highest urban ratios with more than 75 percent, while the sub-provinces of Fereydunšhar, Semirom, and Falāvarjān had the lowest urban ratios with less than 43 percent of their populations residing in urban areas.
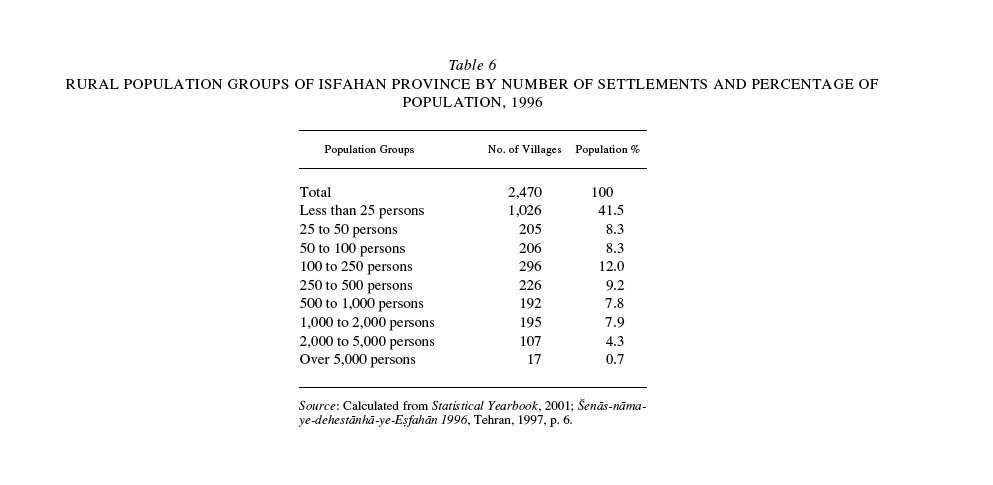
Looking at the rural population, a little more than 1 million persons were settled in 2,470 villages in 1996, yielding an average population of 404 persons per village, which was higher than the national average of 338 persons per village. The majority of the rural population resides in the sub-provinces of Isfahan (20.1 percent), Falāvarjān (12 percent), Faridan (10.2 percent), Najafābād (8.7 percent), and Kāšān (7.3 percent). Together, the populations of these five sub-provinces accounted for 59.2 percent of the total rural population of the province. Approximately 40 percent of the rest of the population were located in 12 other sub-provinces. Table 6 shows the distribution of the rural settlements by population groups.
Close to 50 percent of the rural settlements in this province had a population of less than 50 persons, while the number of villages with populations more than 1,000 did not exceed 12.9 percent (Markaz-e āmār-e Irān, 1997, p. 6).
Migratory tribes. In contrast to the rural and urban populations, the migratory tribal populations cannot be assigned to distinct geographical areas, since they spend part of the year in winter quarters and the other part in summer quarters, each of which are located in different geographical boundaries. Furthermore the migratory tribes have not been similarly defined in the tribal censuses of 1987 and 1998. While the 1987 census counted the entire migratory population, the 1998 census was only concerned with migratory populations whose summer and winter quarters were more than 30 km apart.
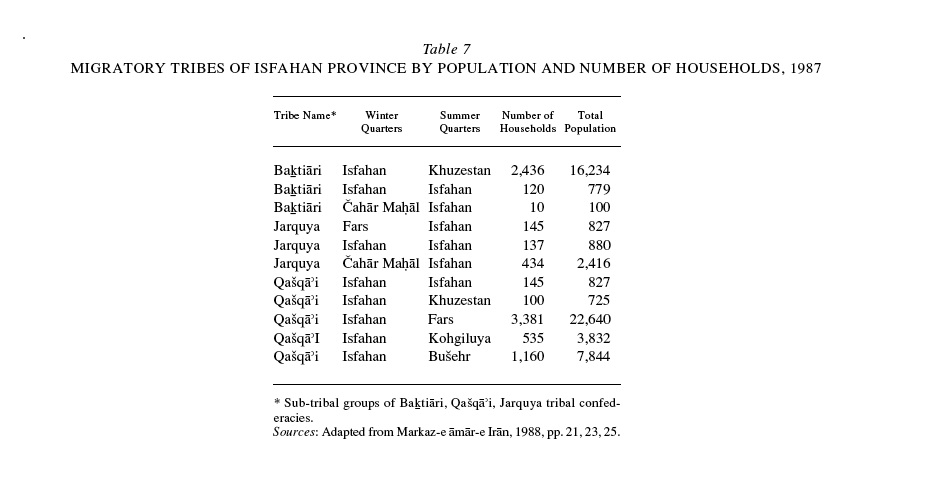
In 1987, clans of the three major tribes (the Baḵtiāri [q.v.], the Jarquya, and the Qašqāʾi [q.v. at iranica.com]) had their summer or winter or even both their summer and winter quarters in the province of Isfahan. Table 7 shows the 1987 figures for summer and winter quarters of the major migratory tribes as well as their populations and number of households.
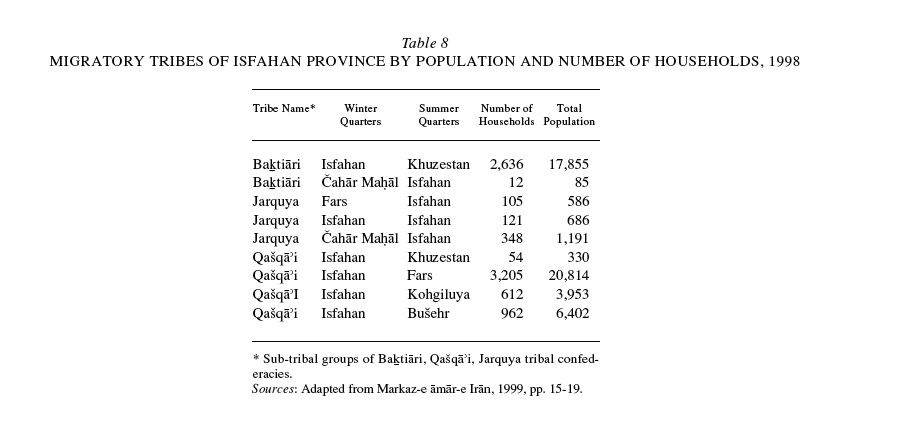
Accordingly, the total population of the migratory tribes whose winter or summer quarters were located in Isfahan Province was 57,104, incorporating 8,603 households, at an average of 6.6 persons per household. Among the 11 tribes in question, the number of Baḵtiāris and Qašqāʾis who spent summers in Isfahan while having winter quarters in Khuzestan and Fars accounted for the majority of the migratory tribal population with just over 70 percent. General information about the migratory tribes whose summer or winter quarters were in Isfahan Province, and whose summer and winter quarters were at least 30 km apart, is given in Table 8, which lists two fewer tribes than Table 7 (above), reflecting the fact that the summer and winter quarters of two tribes in Table 7 were less than 30 km apart
In total, these tribes had a population of 51,902, incorporating 8,055 households, at an average of 6.4 persons per household, an almost identical figure to that of the 1987 census. The slight decrease in the population of migratory tribes is largely a result of the differing definitions of a migratory tribal population between the statistical surveys carried out in 1987 and 1998. The population of migratory tribes in this province accounted for 5.77 percent of the total migratory tribal population of the country as a whole, which, in comparison with the figure in 1987 (4.95 percent), showed an increase of 0.82 percent.
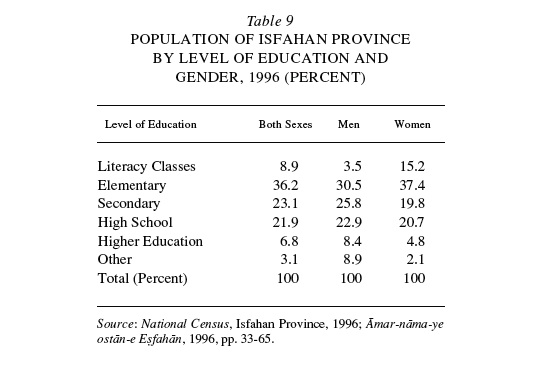
Literacy and education. In 1996, 84.7 percent of the population (88.3 percent of men and 80.9 percent of women) were literate. These figures were 86.9 percent (90.1 percent of men and 83.6 percent of women) among the urban population and 78.1 percent (83 percent of men and 73 percent of women) among the rural population. The distribution of the literate population by level of education is shown in Table 9.
Health and medical services. In 2001, there were 66 hospitals with 5,482 beds operating in Isfahan Province, 52 of which were associated with medical colleges, 7 with private institutions, while the rest were affiliated with other institutions. In the same year, 552 medical clinics and polyclinics, 646 health centers (ḵāna-ye behdāšt), 328 medical laboratories, 476 pharmacies, 139 radiology centers, and 161 rehabilitation centers (markaz-e tavān-baḵši) were active in the province (Statistical Yearbook, 2001, p. 435).
Housing facilities. In 1996, 888,060 ordinary sedentary households occupied the 773,137 residential units of the province, 75.7 percent of which were located in urban areas while 24.3 percent were in rural areas. Accordingly, the ratio of household to residential unit was 1.15 and did not differ from the ratio in the rest of the country. Of the total housing units, 2.5 percent were one-room, 11.1 percent were two-room, 22 percent were three-room, 26.7 percent were four-room, and 37.7 percent were five or more room units. Approximately 68.7 percent of the housing units of the province were built with durable construction materials, 9.6 percent were built with semi-durable materials, and 21.7 percent were built with non-durable materials. Housing units built with durable materials accounted for 76 percent of the total units in urban areas and 46.1 percent of the units in rural areas. Compared to the preceding 20 years, these figures have increased 2.13 times and 8.64 times, respectively (Zanjani et al., 1993, pp. 121-22). Regarding the age of housing units, in 1996, 18 percent were no more than 5 years old, 18.5 percent were between 5 and 10 years old, 34.9 percent were between 10 and 20 years old, and the rest were more than 20 years old. In the same year, 74.6 percent of the ordinary sedentary households resided in owned units, 12.5 percent lived in leasehold units, 9.6 percent resided in free housing units, and the remainder lived in other housing units. In the same year, there were 100 rooms available for every 123 persons (120 persons in urban areas and 133 persons in rural areas). The price of one square meter of land in residential areas saw a 1.77-fold increase between 1996 and 2000. During the same period, the price of one square meter of residential buildings saw a 1.76-fold increase, the cost of renting housing units increased by over 200 percent, and the down payment required for leasing units also saw a 200 percent increase (National Census, Isfahan, 1976 and 1996).
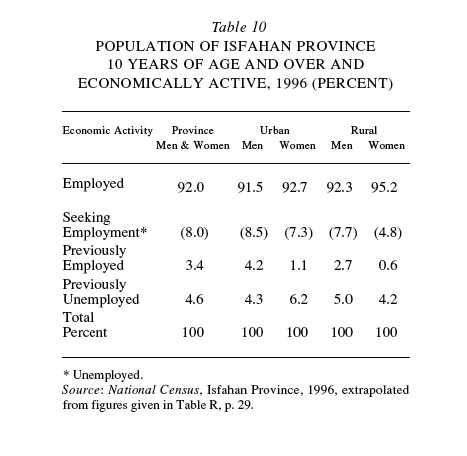
Economic activity and employment. In 1996, approximately 36.7 percent of the ten-year-old and over population in the province were economically active (35.1 percent in urban areas and 41.5 percent in rural areas), of which 85.6 percent were men and 14.4 percent were women. The highest figure of activity for men was among the 35-39 age group with 96.8 percent, and the highest figure for women belonged to the 25-29 age group with 17.8 percent. In 1996, 33.8 percent of the ten-year-old and over population were employed, while 2.93 percent were in search of employment.
The figures in Table 10 below were obtained by calculating the rates of employment and unemployment among the 36.7 percent of the ten-year-old and over population in Isfahan Province who were economically active.
In 1996, 14.5 percent of the employed population ten years of age and over worked in the major industry groups of farming, hunting, and fishing; 12.73 percent in retail or wholesale trades, and motor vehicle repair; 29.85 percent in manufacturing; and the other 42.92 percent were in other major industry groups.
In the same year, 4.28 percent of the employed population consisted of employers, 31.92 percent were own account (self-employed) workers, and 59.89 percent were employees in the public and private sectors. In 1996, 3.71 percent of the employed population provided the sole means of income for their families, 0.35 percent were employees of cooperatives, while 2.19 percent did not report their employment status.
In the survey of the employment situation of the country’s population in 2003 (Markaz-e āmār-e Irān, 2003a, Table 72, p. 337), the percentage of the active population of the province was slightly higher than it was in 1996 (37.4 percent). According to this survey, 87.8 percent of the active population was employed while 12.2 percent was unemployed and searching for employment.
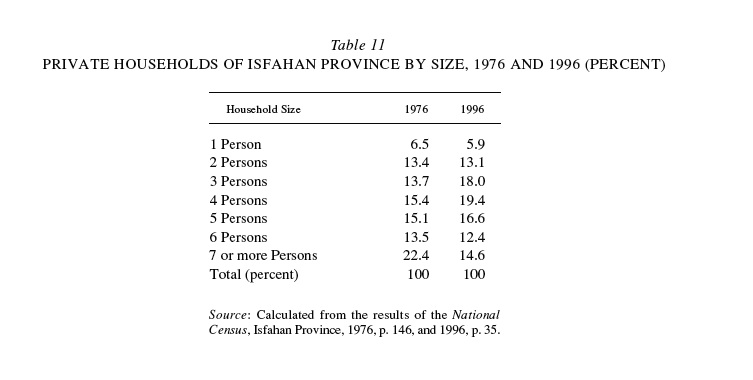
Household size and composition. Of the 888,568 ordinary sedentary households in the province in 1996, 812,863 (91.5 percent) had a male head of household, while 75,705 (8.5 percent) had a female head. These percentages were 91.7 percent and 8.3 percent, respectively, in 1976 and have not changed considerably in the 20-year period from 1976 to 1996. The average size of ordinary households was 4.36 in 1996 (4.3 in urban areas and 4.51 persons in rural areas). This figure has decreased by 7 percent since 1976 (4.7 in urban areas and 4.8 in rural areas). The composition of households according to the number of persons in 1976 and 1996 is shown in Table 11. It shows that the percentage of households with seven or more persons decreased, while the percentage of households with 3, 4, 5, and 6 persons increased.
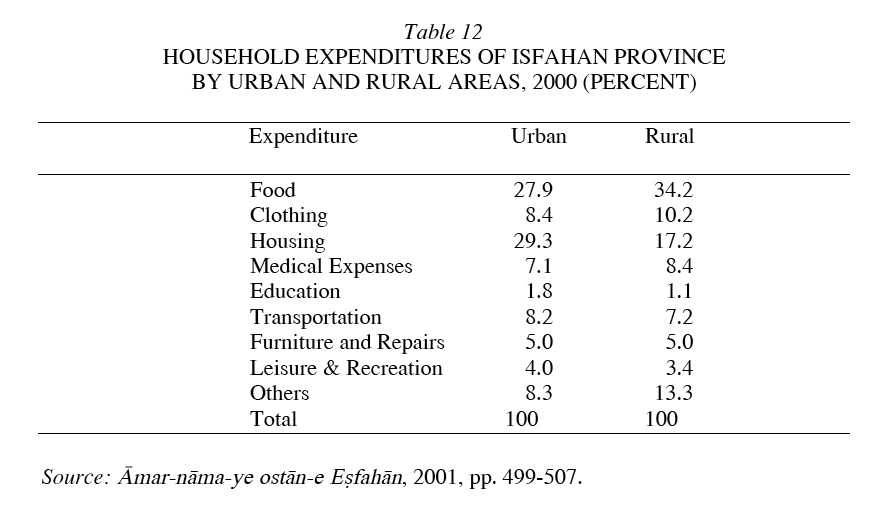
Household income and expenditures. The most recent information about the income and expenditure of Isfahan’s households comes from a survey in 2000. The average annual expenditure of an urban household was 2.02 million tomans, while the average annual expenditure for a rural household was 1.44 million tomans. Non-food expenditures accounted for 72.1 percent of the total expenditure in urban areas and 65.8 percent in rural areas. These expenditures increased by 2.54 percent in the province from 1996 to 2000. The cost of housing made up 40.6 percent of non-food expenditure in urban areas and 29.3 percent in rural areas. The main categories of expenditure for households are presented in Table 12.
The average annual income of an urban household in 1996 was approximately 1.96 million tomans, 35.9 percent of which came from salaries (19.3 percent from the public sector and 16.6 percent from the private sector), 30.3 percent from own account work, and 33.8 percent from other sources. The average annual income of a rural household in the same year was approximately 1.21 million tomans, and the sources of income were as above, accounting for 42.5 percent, 37.3 percent, and 20.2 percent of the total average income, respectively (Āmar-nāma-ye ostān-e Eṣfahān, 2001, pp. 499-507).
Bibliography:
Āmar-nāma-ye ostān-e Eṣfahān, Sāzmān-e barnāma wa budja-ye Ostān-e Eṣfahān, 1996 and 2001.
Markaz-e āmar-e Irān, Saršomāri-e eqteṣādi-ejtemāʾi az ʿašāyer-e kučanda-ye kešvar, Tehran, 1988.
Idem, Šenās-nāma-ye dehestānhā-ye kešvar, Ostān-e Eṣfahān, Tehran, 1998.
Idem, Saršomāri-e eqteṣādi-ejtemāʾi az ʿašāyer-e kučanda-ye kešvar, Tehran, 1999.
Idem, Saršomāri-e nofus o maskan, 1375, natāyej-e tafsili-e ostān-e Eṣfahān, Tehran, 2000.
Idem, Natāyej-e tafṣili-e az hazina wa darāmad-e ḵānavārhā-ye rustāʾi, 2001, Tehran, 2002a.
Idem, Natāyej-e tafṣili-e az hazina wa darāmad-e ḵānavārhā-ye šahri, 2001, Tehran, 2002b.
Idem, Āmārgiri az vižagihā-ye ešteḡāl wa bikāri-e ḵānavār, Tehran, 2003a.
Idem, Bāzsāzi wa barāvard-e jamʿiyat-e šahrestānhā-ye kešvar bar asās-e maḥduda-ye 2001, Tehran, 2003b.
Ḥabib Zanjāni, Mohājerat, Tehran, 2001.
Idem et al., Sawābeq-e jamʿiyati-e šahrhā wa ābādihā-ye Ostān-e Eṣfahān, Ṭarḥ-e kālbodi-e melli, publication nos. 1-5, Tehran, 1993.
(Habibollah Zanjani)
Originally Published: December 15, 2006
Last Updated: March 30, 2012
This article is available in print.
Vol. XIII, Fasc. 6, pp. 623-629