

ILĀM
ILĀM PROVINCE POPULATION
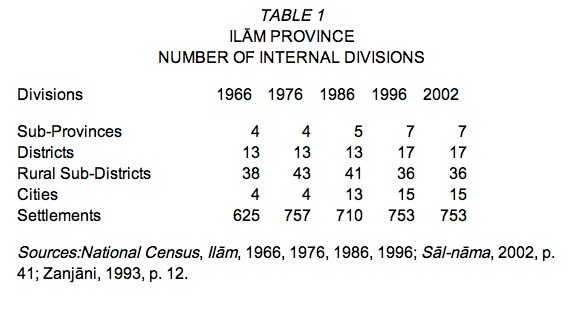
Boundaries and internal division. According to the first national census of 1956, the present province (ostān) of Ilām used to be a sub-province (šahrestān) of the province of Kermānšāhān. In the census of 1966 it became a governerate-general (farmāndāri-e koll), and in the census of 1976 a province. In 1966, its area was 18,162 km2, which was modified to become 19,045 in 1976, 19,086 in 1986, and finally 20,150 km2 in 1996. These modifications were brought about mainly by the separation of Zardelān and Halilān rural sub-districts (dehestāns) from the Kermānšah sub-province and their annexation to form the present boundaries of the Širvān/Čardāvol district (baḵš), itself part of the Ilām sub-province at the time of the annexation. Between 1976 and 1986, Širvān/Čardāvol district was separated from the Ilām sub-province, and in the census of 1986 it was counted as an independent sub-province. Also, between 1986 and 1996 the districts of Eyvān and Ābdānān were separated from the sub-provinces of Ilām and Darrašahr and formed into independent sub-provinces. No modifications have taken place since 1996. The resulting internal divisions of the province are shown in Table 1.
Population and urbanization. In the 40 years between 1956 and 1996, the population of Ilām Province has increased 4.33-fold (3.11-fold for the urban population and 2.1-fold for the rural population) from 110,067 in 1956 to 477,321 in 1996. In the same period, the ratio of urban population has risen from 7.6 percent to 54.4 percent, while the rate of population growth was about 3.7 percent, which was 0.8 percent more than the average for the country as a whole. Table 2 shows the growth of the urban and non-urban (rural, non-sedentary, moving, and migrant) populations of Ilām.
Tribal population. The non-sedentary population, lumped together with the rural population in Table 2, was 13,341, 15,357, and 10,565 in the three post-revolution censuses of 1986, 1991, and 1996. In addition, part of the population of Ilām consists of migratory tribes, the bulk of which is considered by census definition as rural population, while the rest is considered non-sedentary. In the first and second censuses of the migratory tribes, conducted in 1987 and 1998, there were, respectively, 41 and 62 independent tribes and tribal clans, with populations of 73,364 and 74,193. These all had their summer quarters or winter quarters or both in Ilām, as shown in Table 3.
The average household size for all the tribes was 7.32 persons in 1987 and 7.57 persons in 1998. The female/male ratio of the tribal population of Ilām was 1.13 in 1987 and 1.38 in 1998. It may be observed that the size of tribal households increased by about 0.25 persons between the two tribal censuses, whereas the average household size decreased for the country as a whole.
Population distribution and density. Until 1991 less than half of the population of Ilām lived in urban areas. Moreover, most towns were sparsely populated. In fact, during the Iran-Iraq war three towns were totally deserted, four towns had fewer than 5,000 inhabitants, and two towns had between 5,000 and 10,000 inhabitants (see Table 4). Urbanization accelerated between 1956 and 1976; thereafter growth was the same as the average for the whole country.
In 1996, only one city had more than 100,000 inhabitants, and that was the city of Ilām with a population of 126,346 inhabitants, followed by Dehlorān and Eyvān with 23,492 and 23,482 respectively. The least populated town was Lumār, with 772 inhabitants, which was also one of the smallest towns in Iran. The rural population of Ilām lived in 753 inhabited settlements in 1996. In the decade 1986-96, the number of inhabited settlements increased from 710 to 753. In 1996, 42.4 percent of the settlements in Ilām had fewer than 100 inhabitants, 23.8 percent had between 100 and 500 inhabitants; and, out of the remaining 123 settlements with more than 500 inhabitants, only 12, or 1.6 percent of the total, had more than 2,500 inhabitants. The average number of inhabitants per settlement was about 348, which is close to the national average of 338 for villages. One of the reasons for the decline in the rural population of Ilām, in addition to the effects of the war, was the changing of the administrative status of the villages of Pahla and Lumār, with a total population of 5,052 persons, to cities. Unlike many other parts of Iran, urban expansion in Ilām has not led to merger with surrounding villages (Zanjāni, 2004).
Comparison of the total urban population of Ilām between 1976 and 1996 would not be sufficiently accurate because of the creation of three new city districts during this period and changes in their boundaries. The alternative is to compare the population change city by city (Table 4, above); 1966 is the most suitable base year. In 1956 the census method was different, and the population counted for larger settlements included that of surrounding countryside. Also, some present-day cities were classed as large settlements then.
Table 4 shows that the rate of growth of all the cities, with the sole exception of Meyme, has been above their natural rates of growth, and even its growth is only slightly lower than the natural rate. This signifies that villages are gradually losing their significance as population centers, which may also be corroborated by the higher than average decline in the rate of rural employment: from 78.8 percent in 1966 to 29.7 percent in 1996, compared to 56.3 percent and 23.0 percent for the national average.
Population density has always been lower in Ilām than the national average, mainly because of lack of medium and large cities. The gap has, nevertheless, narrowed. The ratio of population density of Ilām to the national average has risen from 48.0 percent to 64.4 percent between 1966 and 1996. Still, as shown in Table 5, comparison with the Zāgros region and the country as a whole shows the relatively low population density of Ilām per km2 in Dehlorān sub-province to 76.5 in Ilām sub-province. The most important increase took place in Ilām sub-province, where it went from 16 in 1966 to 76 in 1996. Table 6 shows the main population characteristics of sub-provinces of Ilām Province.
Fertility and mortality. Table 7 shows reproduction and mortality statistics as reported for Ilām by the Bureau of Registration (Sāzmān-e ṯabt-e aḥwāl-e kešvar) from 1997-2002.
Table 7 (above) indicates that the average natural annual increase in the population of Ilām has been 6,137 persons, which gives an annual rate of growth of 1.2 to 1.4 percent. With such a rate of growth, the population of Ilām could double in 55 years. According to the Regional Development Plan (Zanjāni, p. 50), in 1996 the fertility rate in Ilām was about 4.12 children, and the rate of mortality was 8.3 per thousand (7.1 for urban areas and 9.2 for rural areas; Zanjāni, and Nur-Allāhi, 2000, p. 65)
Migration. In the past the rate of growth of the population in Ilām has been quite heterogeneous; it does not, therefore, provide a solid basis for the analysis of migration. Between 1976 and 1986 some 56,475 immigrants and some 60,672 emigrants were counted, of whom 45,636 moved only within the province. As a result, the number of immigrants into the province is reduced to 10,839, and the number of emigrants out of the province is reduced to 15,036 with a negative migratory balance of 4,197 persons, which depicts a weak emigration capacity. In the next decade, there were 94,983 immigrants, 99,574 emigrants, and 70,234 internal displacements with a negative migratory balance of 4,593 persons. It is interesting to note that the negative migratory balances for the urban and rural populations were 3,997 persons and 596 persons, respectively (National Census, Ilām, 1986, 1996)
Literacy. In 1996, nearly 77 percent of the six-year-old and above population of Ilām Province (82 percent for men and 71.2 percent for women) were literate. Table 8 shows these ratios for census years 1966-96.
The literacy ratio, especially for women, rose very sharply after the revolution; between 1976 and 1996 it increased by 96 percent in urban areas and by 538 percent in rural areas. In 1996, 4,398 persons (3,070 men and 1,318 women) pursued higher education in Ilām, of whom 27.8 percent were doing A.A. (two-year Associate degree) courses, 67.7 were doing B.A. work, 2.8 percent, M.A. work, and 1.8 percent, doctoral studies (National Census, Ilām, 1976, 1986, 1996).
Religion. In 1996, the overwhelming majority of the population of Ilām was composed of Muslims, the percentage of Muslims accounting for 99.9 percent of the population. Among the 162 non-Muslims, 158 were Zoroastrians and two Christians (National Census, Ilām, 1966, 1976, 1986, 1996).
Marriage. In 1996, nearly 63.3 of the over 15-year-old population of Ilām had been married at least once; 58.7 percent were married, 4.4 had lost their spouses, and 2.6 percent were divorced. The ratio of married people in the urban areas was 58.7 for men and 61.2 percent for women, and in the rural areas the ratio was 56.0 percent for men and 58.9 percent for women (National Census, Ilām, 1966, 1976, 1986, 1996).
Household composition. In 1996, there were 82,373 households in Ilām Province, of which 97.87 percent (80,420) were ordinary sedentary households, 2.1 percent (1,749) ordinary non-sedentary households, and less than 0.25 percent collective households; 55 percent of the households lived in the cities, 42.9 percent lived in the villages, and 1,749 non-sedentary households accounted for 10,565 members of the non-sedentary population. Ordinary households on average were composed of 5.84 members (5.66 for the urban and 6.06 for the rural areas), which exceeded the national averages by 1.07, 1.10, and 0.92 percent respectively; 5.24 percent of the ordinary households were composed of the head of the household and his spouse; 69.66 percent were composed of the head of the household, his spouse, and children; and the rest were composed otherwise. Nearly 92.6 percent of the heads of the ordinary households were men, and 7.4 percent were women; 76.6 percent of the heads of the households (81.8 percent for men and 11.6 percent for women) were employed; 4.3 percent of the households had 7 members, followed by 13.73 percent for households with 6 members. Table 9 compares the distribution of households in Ilām with the country as a whole. The differences were more marked in the urban areas.
Housing and housing facilities. Out of the 70,276 ordinary housing units inhabited by 79,775 households (an average of 1.13 households per housing unit), 67.7 percent were built of durable materials, 9.1 percent of semi-durable materials, and the rest (23.2 percent) were non-durable housing units. Six hundred and sixty-five households lived in tents, barracks, or makeshift dwellings, with the majority (606) in tents. This mode of living was more common in the rural areas (656 compared to 9 in the cities) and was connected to tribal life. As for utilities, 97.7 percent of the households had electricity (98.8 in the cities and 95.5 in the villages), 92.2 percent had piped water (98.8 in the cities and 83.6 in the villages), 35.6 percent had telephones (51.9 percent in the cities and 14.3 percent in the villages), and nearly 60 percent had bathrooms in their houses (81.9 in the cities and 31.2 percent in the villages). Owner-occupied habitats comprised 77 percent of the households (69.7 percent in the cities and 86.6 percent in the villages), and 12.7 percent (18.9 percent in the cities and 4.5 percent in the villages) were leaseholders. The rest had other types of housing at their disposal.
Activity and employment. The rate of activity and unemployment of the over ten-year-old population of the province is shown in Table 10.
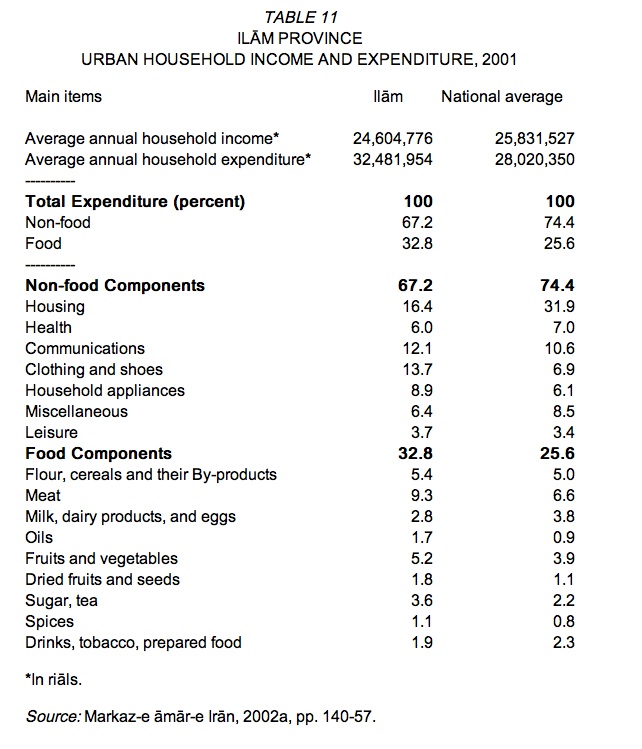
Household income and expenditure. Household income and expenditure data for Ilām have been published only for recent years. Table 11 shows the results of the household incomes/expenditures sampling survey based on 305 urban households in Ilām (out of 12,337 urban households across the country) carried out in 2001
It may be noted that average household expenditures have exceeded average household incomes by 32 percent for Ilām and by 8.5 percent for the whole country. This is due to the fairly common understatement of incomes and the less common overstatement of expenditures in statistical surveys and also due to the fact that all sources of income could not exhaustively be specified in the questionnaires. Table 12 shows the principal sources of income for an average urban household in Ilām compared to the national average.
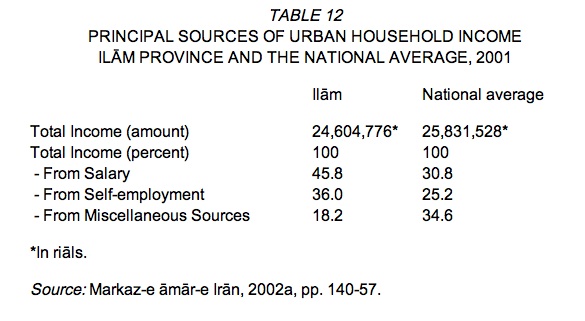
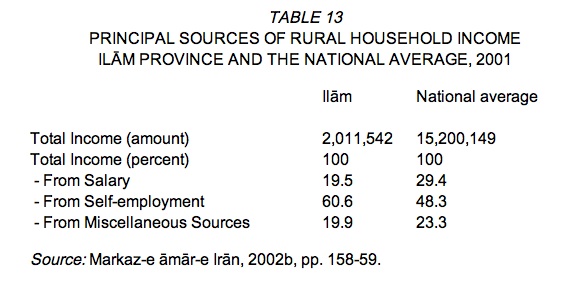
The table shows that the average household in Ilām relies much more on salary as a source of income than the national average. Table 13 gives the same data for rural households and the comparison depicts the opposite situation in regard to the salary component.
As a source of income, for rural Ilām, self employed professions, including agriculture, seem to be predominant, even more predominant than the national average.
Table 14 shows the results of the household incomes/expenditures sampling survey based on 245 rural households in Ilām (out of 14,624 rural households across the country) carried out in 2001
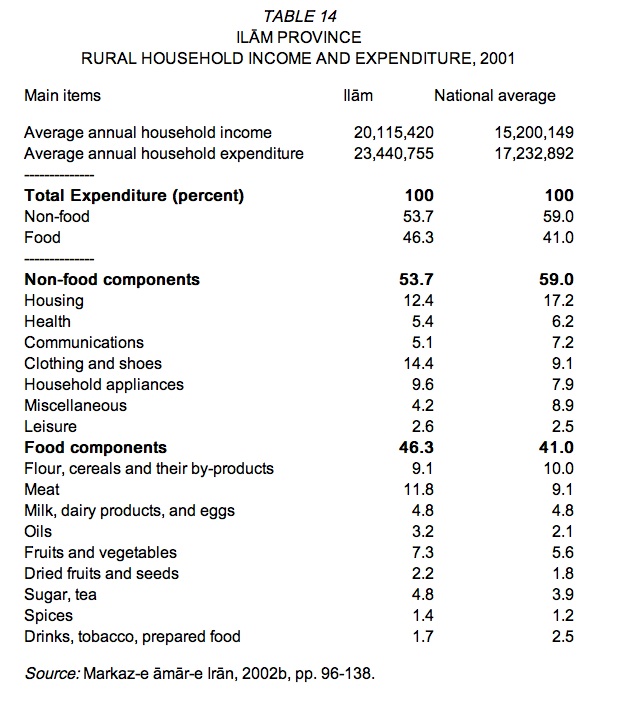
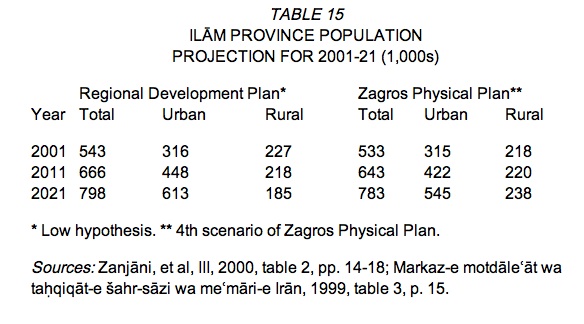
Population projection. On the basis of two studies made in the Regional Development Plan (RDP; Ṭarḥ-e āmāyeš-e sarzamin) and Zagros Physical Plan (ZPP; Ṭarḥ-e kālbodi-e Zāgros), the population of this province is likely to grow from 2001 to 2021 in the manner shown in Table 15.
THE CITY POPULATION
In the census of 1956, the city of Ilām was the center of the sub-province of Ilām, which covered more or less the same area as the present-day province (ostān) of Ilām. In the census of 1966, it was also the capital of the General Governerate (farmāndāri-e koll) of Ilām. In later censuses it became the provincial capital as well. Until 1986, the city’s expansion was confined to its own suburbs, and no other town or settlement was merged into it.
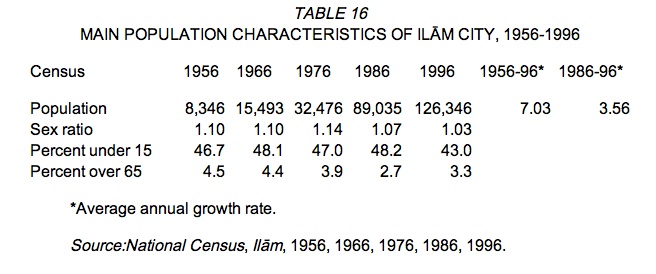
Population. Ilām City population increased from 8,346 in 1956 to 126,346 in 1996 with a growth rate of 7.03 percent, one of the highest for provincial capitals in Iran.
It has to be pointed out that, whereas in the censuses of 1956, 1966, and 1976 population data were made available for all the cities individually across the country, in later censuses these data were lumped together for city districts, not the individual cities. Since the revolution, only a summary of the data has been given in the first chapter of each census. Consequently, it is not always possible to compare various features of the population of the cities, including Ilām. In 1986, the City District of Ilām contained three cities, while in 1996 it only contained two. In 1996, 95.8 percent of the urban population of Ilām lived in the city of Ilām, and the second largest city, Čavār, accounted for only 5,482 persons, or 4.2 percent of the population. Table 16 gives the main population characteristics of Ilām City in various censuses. As we can see, even in 1996, over 43 percent of the population of the city was under 15 years of age, which is considered structurally young. The annual rate of growth of the population in the last decade was less than half that of the 40-year (1956-96) period. This is a steep decline, although it was still above the rate of growth of the urban population for the whole country (3.21 percent). In 1996, the gender ratio was close to natural gender ratio, and its difference from pre-1979 revolution censuses was basically in the method of taking into account collective households, such as soldiers.
As was pointed out above, comparison of economic and social data of Ilām for the past four decades cannot be made, because these data have not been published for individual cities since the revolution. We are, therefore, obliged to limit our horizon to the decade 1986-96 within the orbit of published data.
Education and literacy. In 1986, 67.9 percent of the over six-year-old population of Ilām (77.0 percent for men and 57.9 percent for women) was literate. In 1996, this ratio had risen to 84.4 percent (88.5 percent for men and 80.2 percent for women). The percentage of students amongst the over six-year-old population is shown in Table 17.
The figures show a clear growth in the percentage of students, especially at the preparatory and high school levels.
In 1996, there were some 6,270 (4,157 male and 2,113 female) university graduates or university students in the urban population of the City District of Ilām, as compared to 471 (382 male and 89 female) for 1976, which shows that in two decades the number of men with higher education has increased 10.9 times and the number of women with higher education has increased 23.7 times, a most significant index of social change.
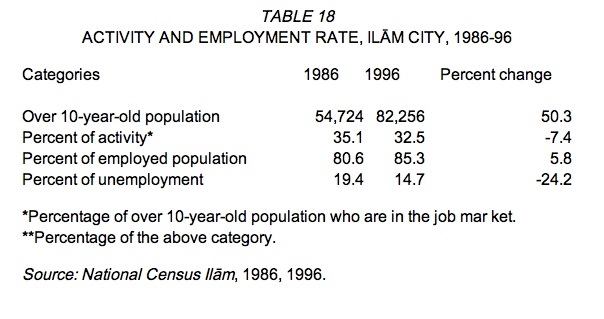
Activity and employment. Table 18 shows the situation of activity and employment of the population of Ilām City in the years 1986 and 1996.Despite the decline in unemployment, because the ratio of activity has fallen and the size of the population has increased, the number of the inactive population has risen by 56.3 percent from 35,516 to 55,523. The number of unemployed has also risen by 12.5 percent (9.3 percent for men and 30.7 percent for women). Women accounted for 15.2 percent of the unemployed in 1986 and 17.7 percent in 1996. In 1996, 53.5 percent of the unemployed were in the 10-24 year-old age-group and 38.6 percent in the 25-64 year-old age-group. Almost 12 percent of the unemployed had elementary education, 65.3 had preparatory school or high school education, and 15.4 were illiterate, compared to 15.4 percent, 46.1 percent, and 37.3 percent ten years earlier, which shows displacement of unemployment towards the more educated.
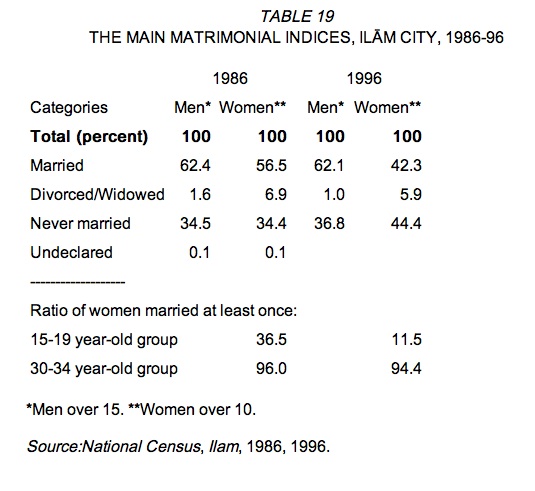
Marriage. The main matrimonial indices for Ilām City in the years 1986 and 1996 are given in the Table 19.
The decrease in the ratio of married people and the more marked decrease in the ratio of married women in the 15-19 year-old age-group must reflect the rising number of women attending institutions of higher education. This is also borne out by the high rate of marriage in the higher age groups. In 1996, 98.3 percent of the 40-45 year-old women were married, which was more than or the same as before the revolution.
Housing and housing facilities. In 1996, 69.9 percent of the ordinary households of Ilām owned their residences, 19.5 percent were tenants, and 9.9 percent lived in free housing or housing provided against services. The comparable ratios in 1986 were: 62.8 percent, 18.2 percent, and 18.6 percent. In 1996, 99.4 percent of the households had electricity, 99.3 percent had piped water, and 50.1 percent had telephones; 98.3 percent use gas for cooking. Only 4 households lived in makeshift dwellings.
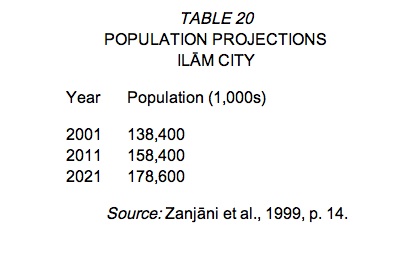
Population projections. Ilām is the only city with more than 100,000 population in the province. According to the middle projection of the Regional Development Plan (Ṭarḥ-e āmāyeš-e sarzamin, p. 14) it will have a fairly low rate of growth of population, about 1.3 percent per year) until 2021 (Table 20), while the small and middle towns will gain in importance in the urbanization structure of the province
Bibliography:
Markaz-e āmār-e Irān, Natāyej-e tafṣili-e saršomārihā-ye ʿomumi-e nofus wa maskan, Ostān-e Ilām 1355-75 (Detailed results of the national census of population and housing, 1976-96, Ilām Province), Tehran, 1998a.
Idem, Natāyej-e tafṣili-e saršomārihā-ye ʿomumi-e nofus wa maskan, 1355-75, Šahrestān-e Ilām (Detailed results of the national census of population and housing, 1976-96, Ilam Sub-Province), Tehran, 1998b.
Idem, Saršomāri-e eqteṣādi-ejtemāʿi az ʿašāyer-e kučanda, 1366: koll-e kešvar (Socio-economic census of migratory tribes: total country, 1987), Tehran, 1988c.
Idem, Saršomāri-e eqteṣādi-ejtemāʿi az ʿašāyer-e kučanda, 1377: Koll-e kešvar (Socio-economic census of migratory tribes: total country, 1998), Tehran, 1999.
Idem, Natāyej-e tafṣili-e āmārgiri az hazina wa darāmad-e ḵānavārhā-ye šahri, 1380 (Detailed results of the survey of urban household income and expenditure, 2001), Tehran, 2002a.
Idem, Natāyej-e tafṣili-e āmārgiri az hazina wa darāmad-e ḵānavārhā-ye rustāʾi, 1380 (Detailed results of the survey of rural household income and expenditure, 2001), Tehran, 2002b.
Markaz-e moṭāleʿāt wa taḥqiqāt-e šahr-sāzi wa meʿmāri-e Irān, Ṭarḥ-e kālbodi-e melli, gozāreš-e talfiqi (National physical plan) I, 1996.
Idem, Ṭarḥ-e kālbodi-e manṭaqa-ye Zāgros (Physical plan of the Zagros region), 3 vols., Tehran, 1999.
Sāzmān-e modiriyat wa barnāma rizi-e ostān-e Ilām, Sāl-nāma-ye āmāri-e ostān-e Ilām, 1378 (Statistical profile of Ilām, 1999), Tehran, 2000.
Idem, Sāl-nāma-ye āmāri-e ostān-e Ilām, 1381 (Statistical profile of Ilām, 2002), Tehran, 2003.
Ḥabib-Allāh Zanjāni et al., Sawābeq-e jamʿiyati-e šahrhā wa ābādihā-ye ostān-e Ilām, Moṭāleʿāt-e ta-ḥawwol-e jamʿiyat-e Irān dar ṭarḥ-e kālbodi-e melli (Population of cities and villages of Ilām Province in National Physical Plan), Markaz-e moṭāleʿāt wa taḥ-qiqāt-e šahr-sāzi wa meʿmāri-e Irān, Tehran, 1993.
Idem, et al., Moṭāleʿāt-e jamʿiyat darṭarḥ-e āmāyeš-e sarzamin II (Population surveys in the regional planning project, vol. II), Tehran, Markaz-e moṭāleʿāt wa taḥqiqāt-e šahr-sāzi wa meʿmāri-e Irān, 1999.
Idem and Ṭāhā Nur-Allāhi, Jadāvel-e marg o mir-e Irān barā-ye sāl-e 1375 (Mortality Tables for Iran, 1996), Moʾassesa-ye ʿāli-e taʾmin-e ejtemāʿi, Tehran, 2000.
Idem, Mo-hājerat, (Migration), Sāzmān-e moṭāleʿa wa tadwin-e kotob-e ʿolum-e ensāni-e dānešgāhhā, Tehran, 2001.
Idem, et al., Rāhnemā-ye jamʿiyat-e šahrhā-ye Irān (Population guide for Iranian cities), 2nd ed., Markaz-e moṭāleʿāt wa taḥqiqāt-e šahr-sāzi wa meʿmāri-e Irān, Tehran, 2004.
(Habibollah Zanjani)
Originally Published: December 15, 2004
Last Updated: March 27, 2012
This article is available in print.
Vol. XII, Fasc. 6, pp. 631-639
Habibollah Zanjani, “ILĀM iii. POPULATION,” Encyclopaedia Iranica, XII/6, pp. 631-639, available online at http://www.iranicaonline.org/articles/ilam-iii (accessed on 30 December 2012).